


(Case study) Network management platform・Polish+

A network-management console reorganized with a clear information hierarchy for everyday use

A professional network-management platform monitors traffic and security status for the websites of many corporate groups. As features and the customer base grew, the back office needed a clearer information hierarchy. The project reorganized the hierarchy and operating flow so that engineers can find features quickly when handling urgent situations.

Book the first meeting

A network-management console reorganized with a clear information hierarchy for everyday use
Industry
Network management platform
Service
Polish+
Scale
20 site states, nearly 200 dedicated icons
Live
Delivered on schedule in six months, ahead of a security expo

(Challenge)

Features kept growing, and the back office needed a clearer navigation structure

The platform monitors traffic and security status for the websites of many corporate groups. Features multiplied with the customer base and new features kept being added to a drop-down sidebar, so engineers scrolled down the menu to find the feature needed.

Users were sometimes unsure which menu held the feature being sought. For engineers who must clear urgent incidents quickly, shortening the search time is the first goal.

Presales staff, product managers, technicians and front-end and back-end engineers each expected something different from the platform. The team spent about 2 months on interviews, recorded the difficulties each group met, then sorted and ranked those difficulties to set project goals, and drew on the platform manual the client gives partner companies.
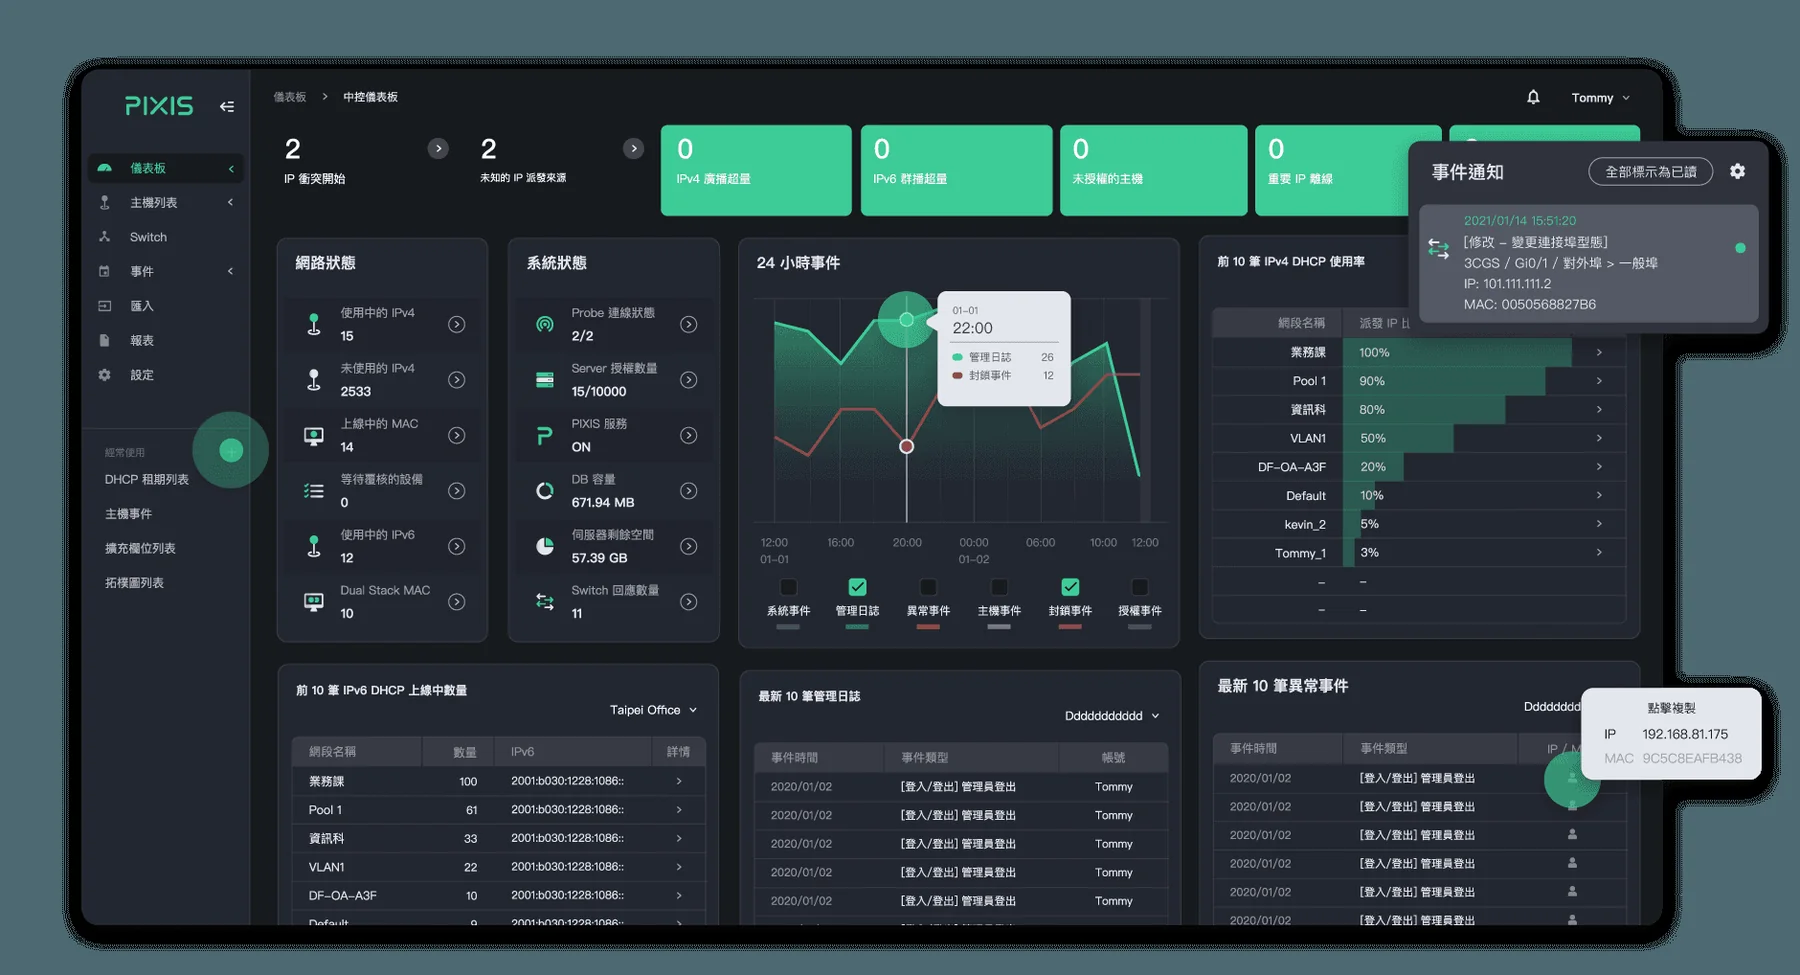
The redesigned dashboard.

(Approach)

Design the main pages first, then derive the rules

The platform is technically demanding and must cover many operating scenarios as well as responsive design. With complex requirements and varied components, the team designed the most frequently used pages first, identified the logic shared among those pages, consolidated it, and then applied the resulting design rules to the remaining supporting pages.

The components went through planning, design, review, adjustment, testing and confirmation, with more than 10 iterations, before the highly reusable component set was complete.
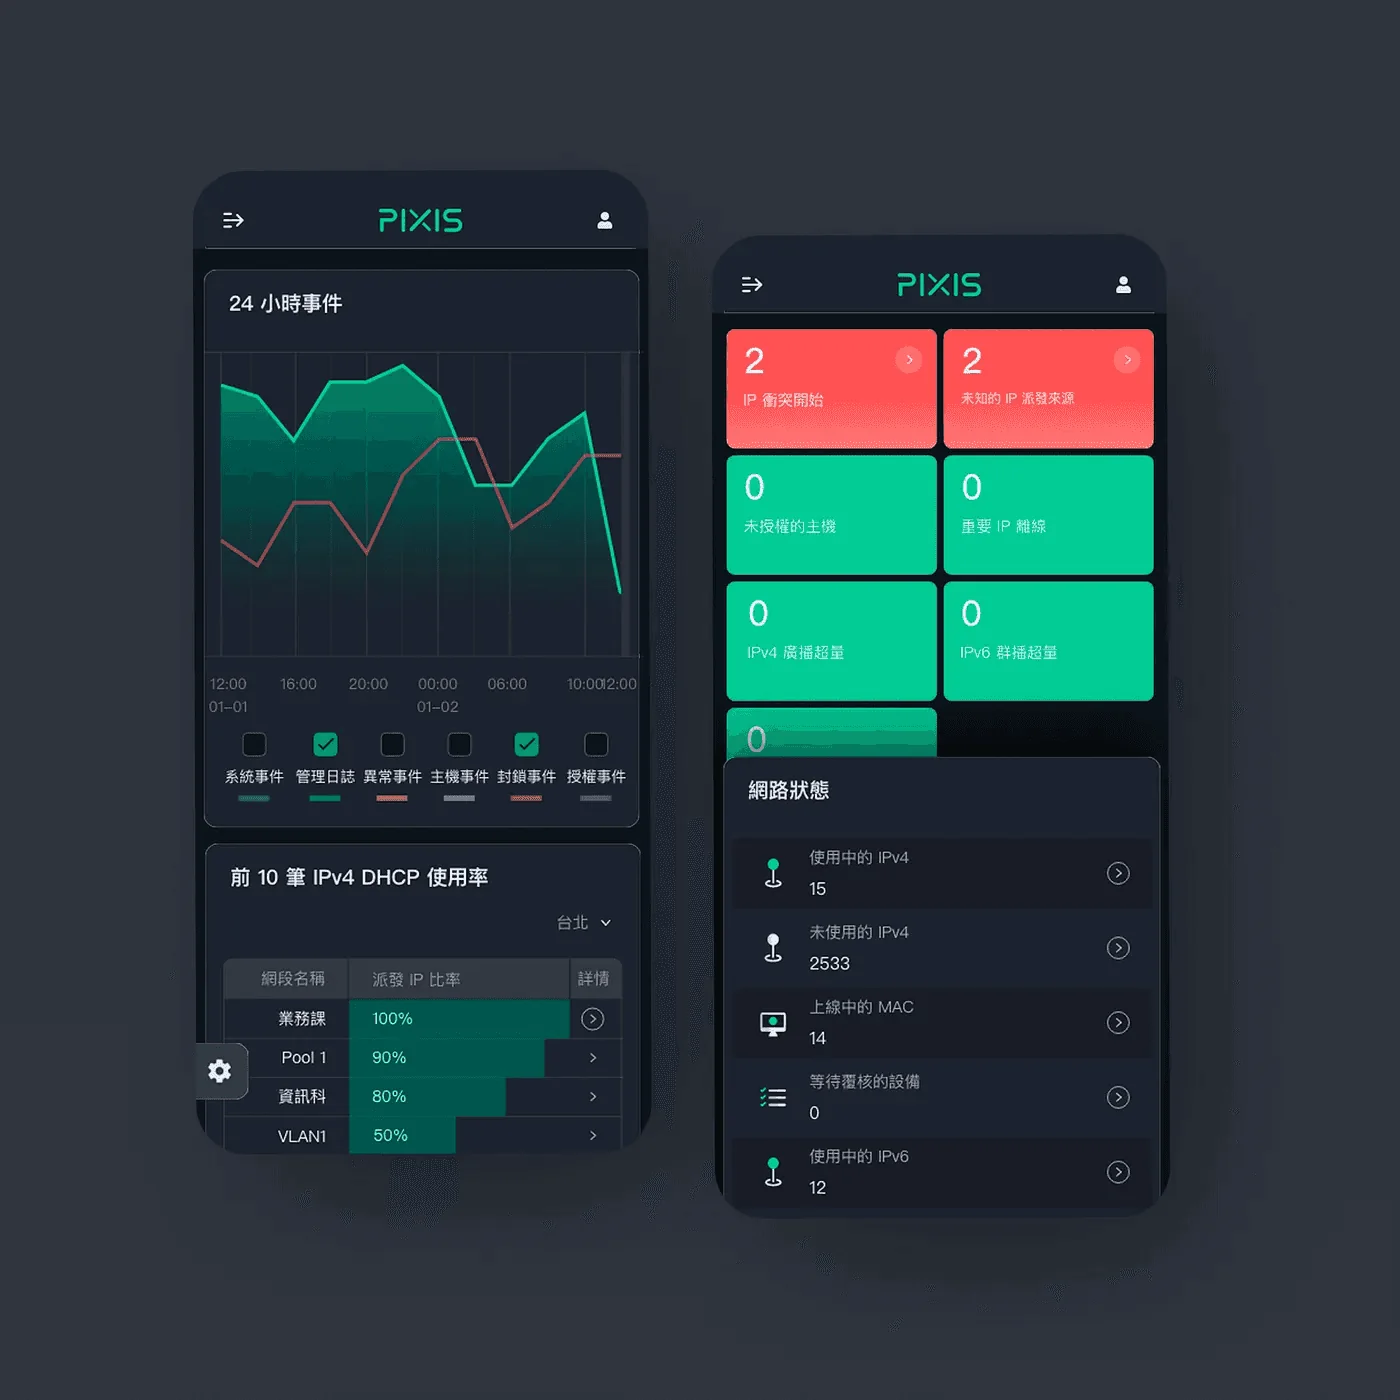
Responsive design of the key interfaces.
Interviews set the goals, the main pages yield the rules, and the rules are applied to the remaining pages
Interviews
Main pages
Distilling
Applying
Project
1
ProjectMultiple interviewsAbout 2 months, covering pre-sales, product managers, technical staff and engineers
2
ProjectMain pages designed firstThe most frequently used pages come first
3
ProjectCommon logic distilledComponents went through more than 10 iterations
4
ProjectApplied to supporting pages

The whole project took half a year and was delivered on time ahead of the security expo.

(Key design)

Three key designs

Horizontal panels

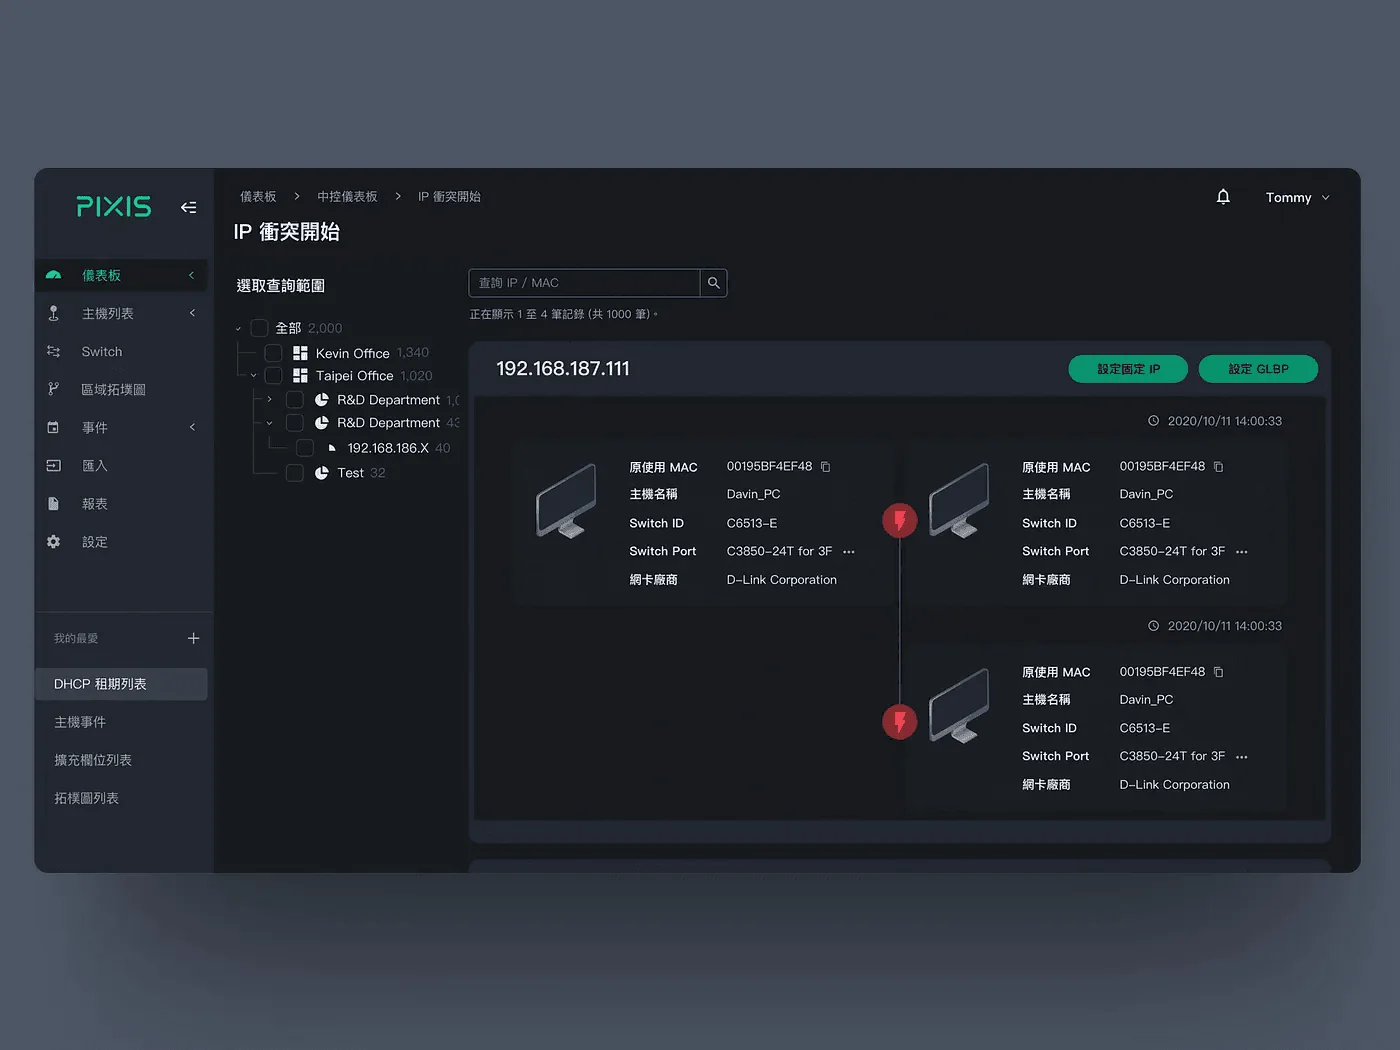
The new version groups related features into blocks and combines primary and secondary sidebars, drop-downs, bookmarks, tree views and multi-level modals with a left-to-right horizontal panel, so users can switch between levels and find features quickly.
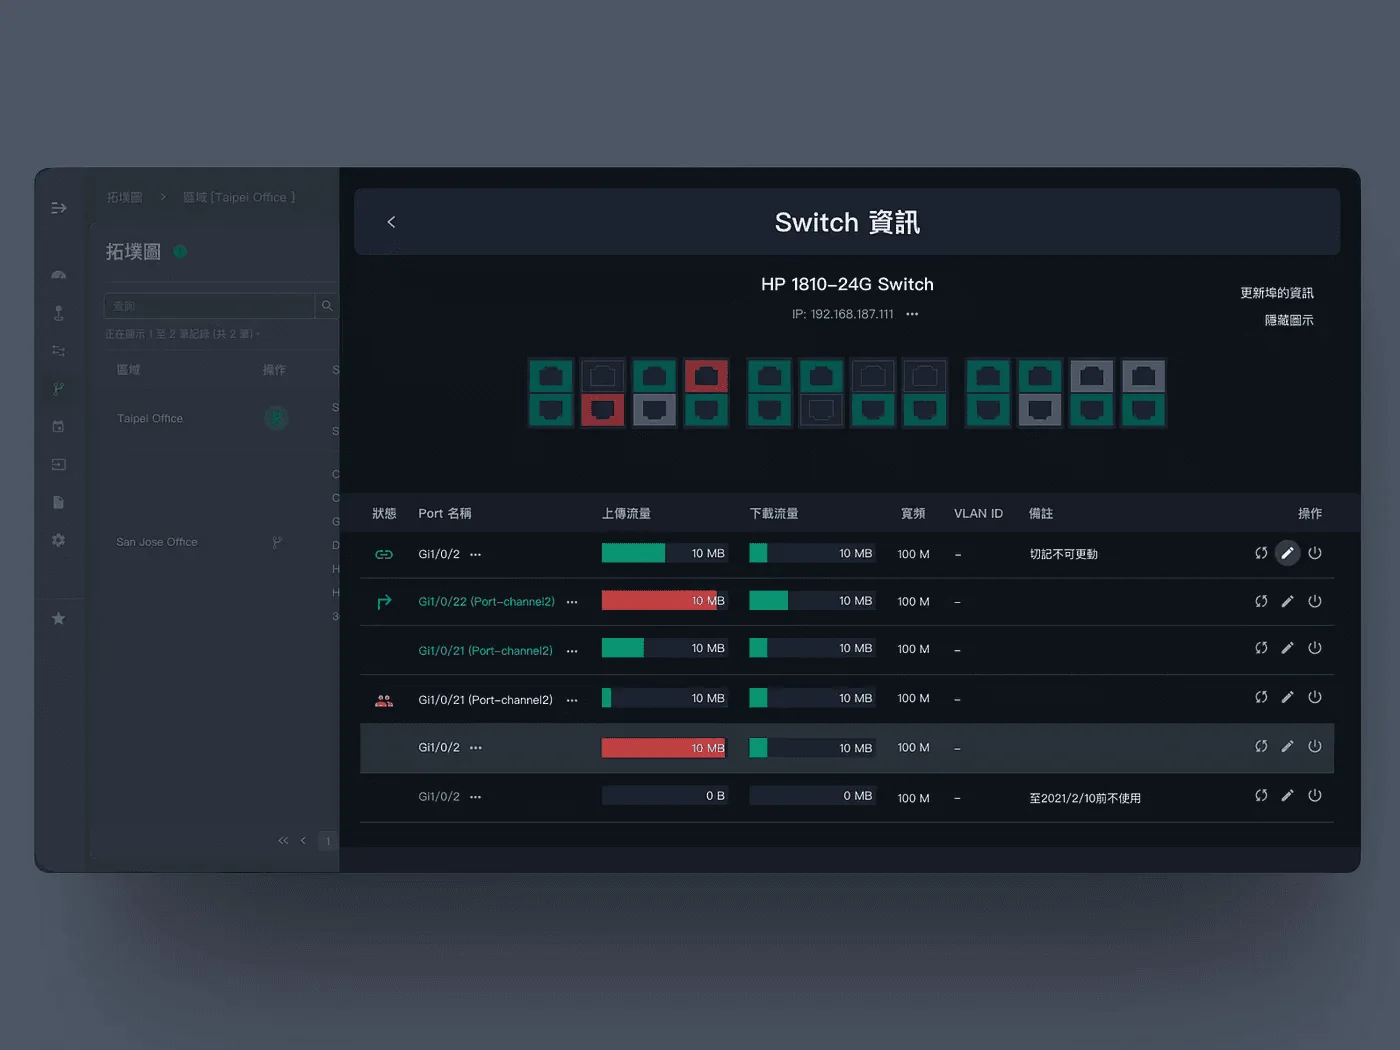
Switch information page: multi-level data is set in a side modal, and selecting an individual port opens another side modal.
The IP lookup page, listing related devices and ports.

Reusable components

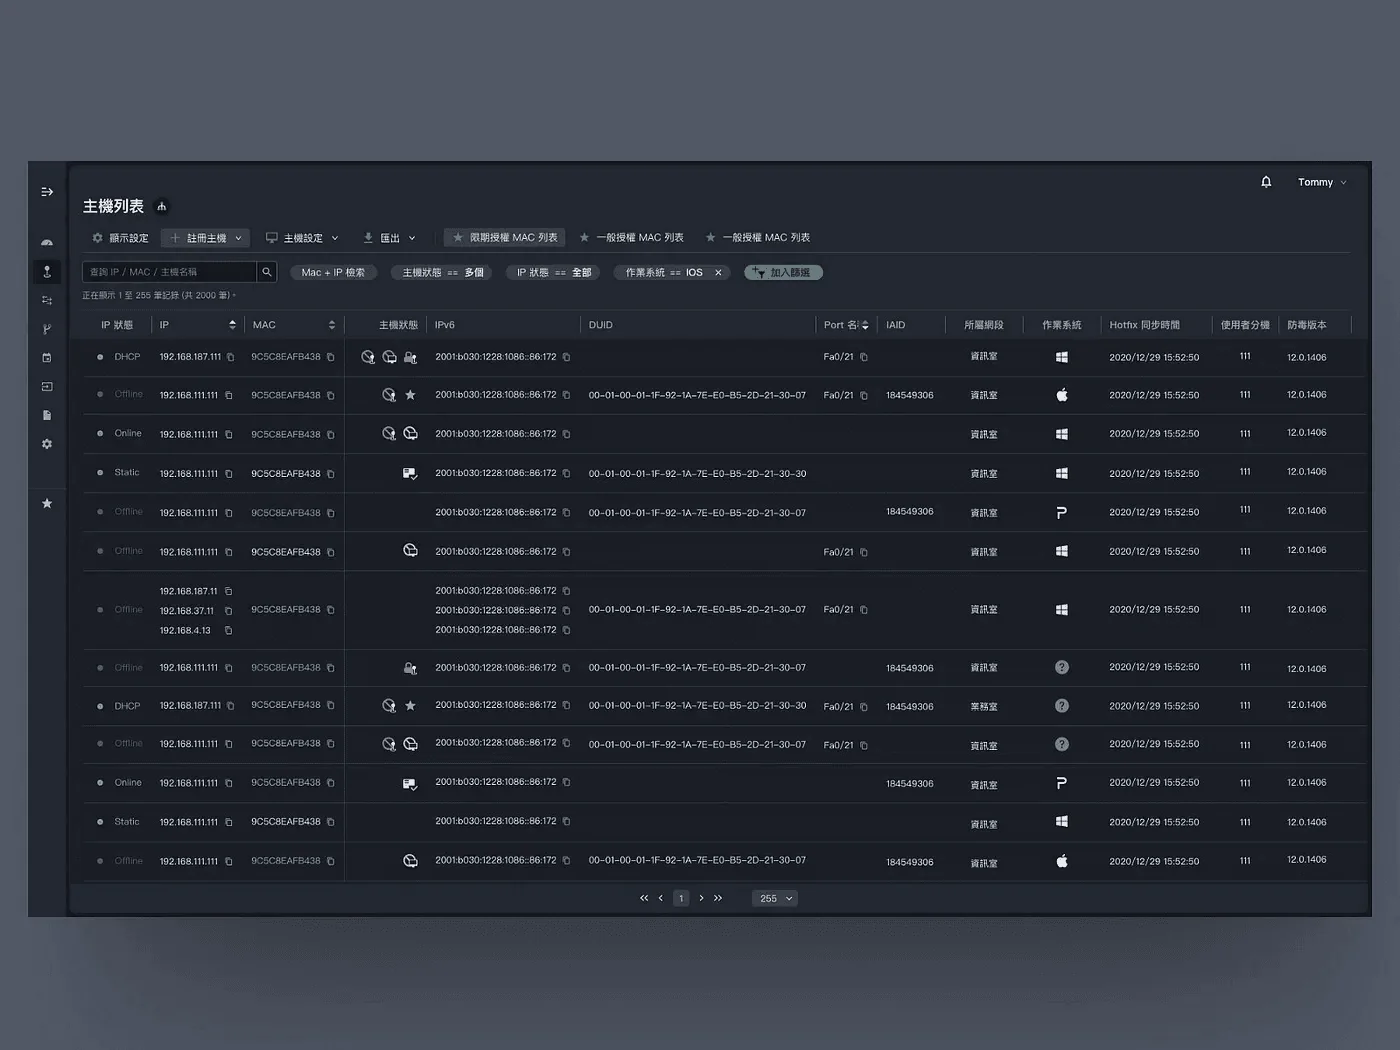
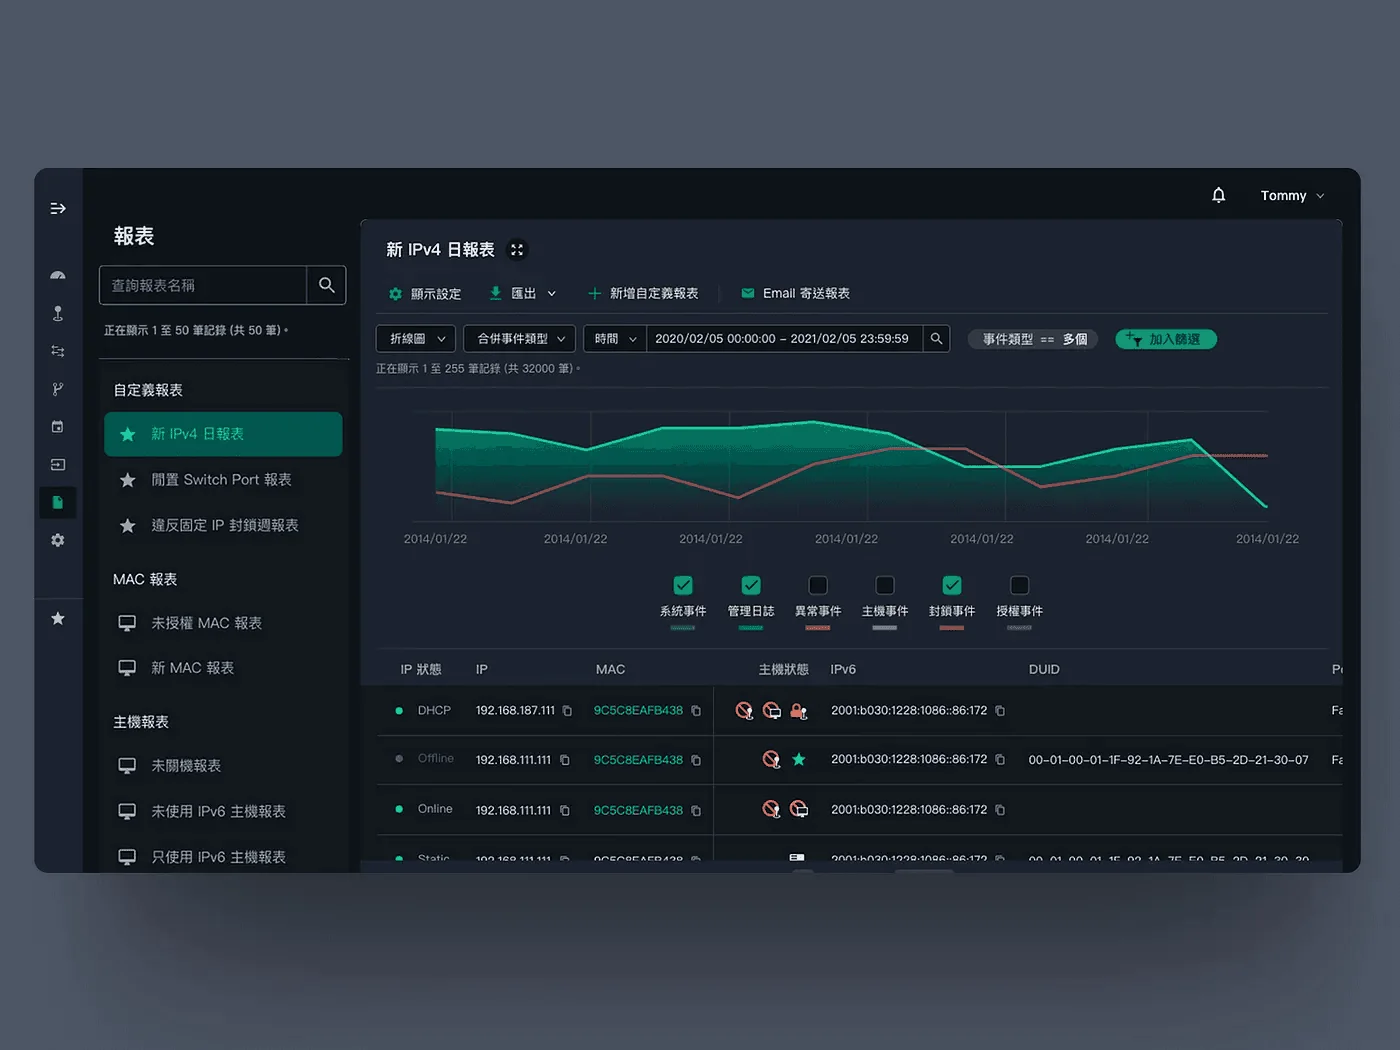
Pages used often and holding large volumes of data, such as the host list, are built from a highly reusable table component and topology-map component. A right click on the host list opens the full set of actions for each host, organized and sorted by function type.
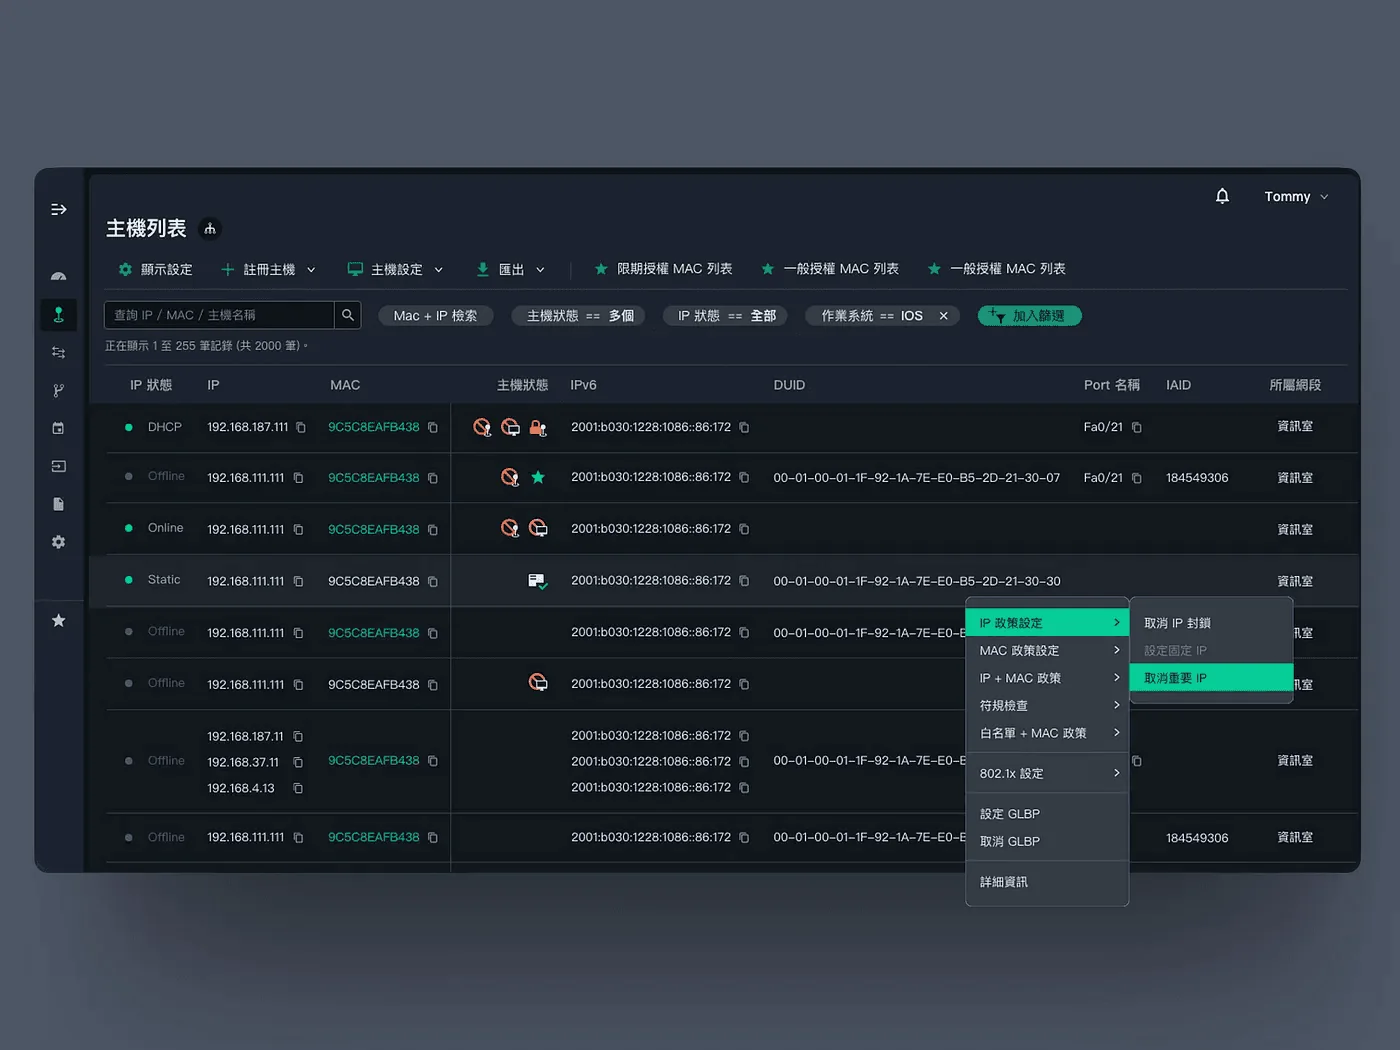
Host list: a right click opens the full set of actions for each host, sorted by function type.
The host list, built from the same table component with columns set as needed.

Visualizing complex information

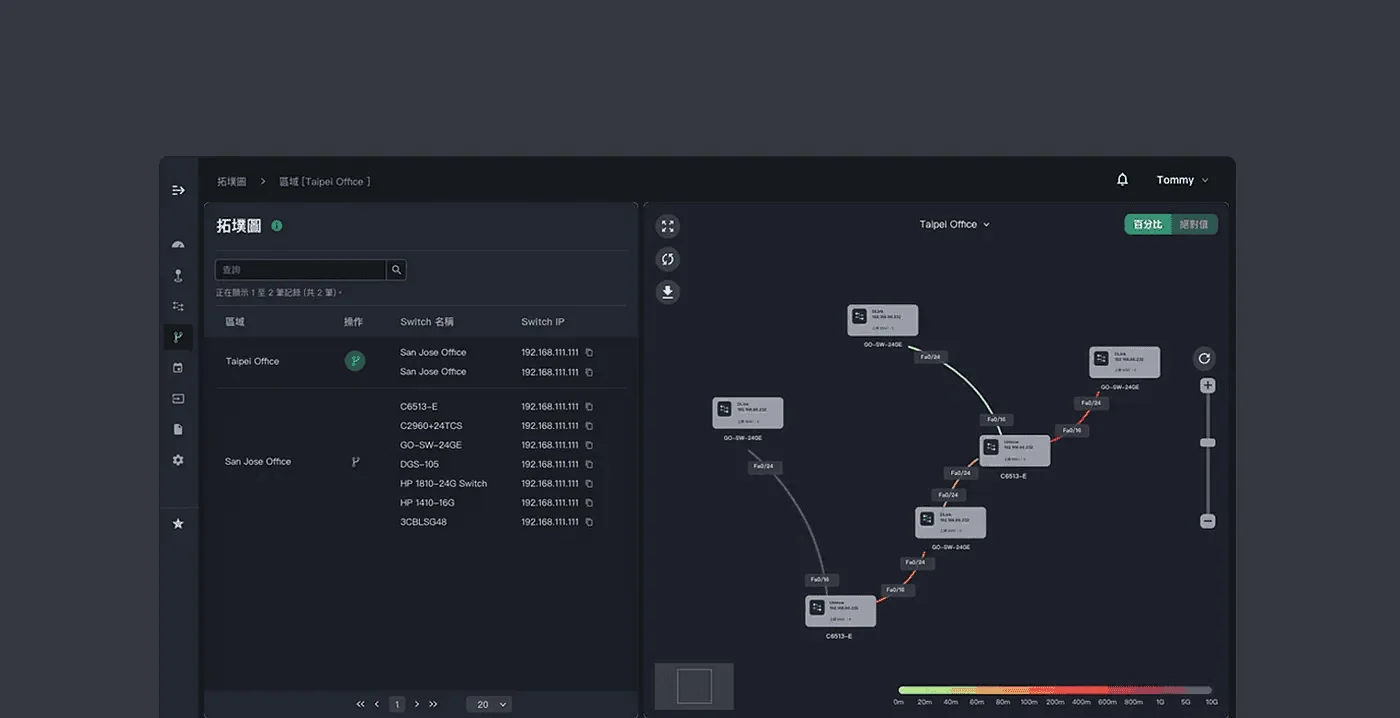
The platform's brand green runs through the interface and signals normal status, while red and yellow mark abnormal states. All color levels sit below text, so key points stand out without glare. Topology maps and host and traffic status are shown as images with monochrome gradients to aid recognition. Site status is sorted into 20 types, and nearly 200 table-specific icons were designed so that MIS staff can clear site faults within the critical window.
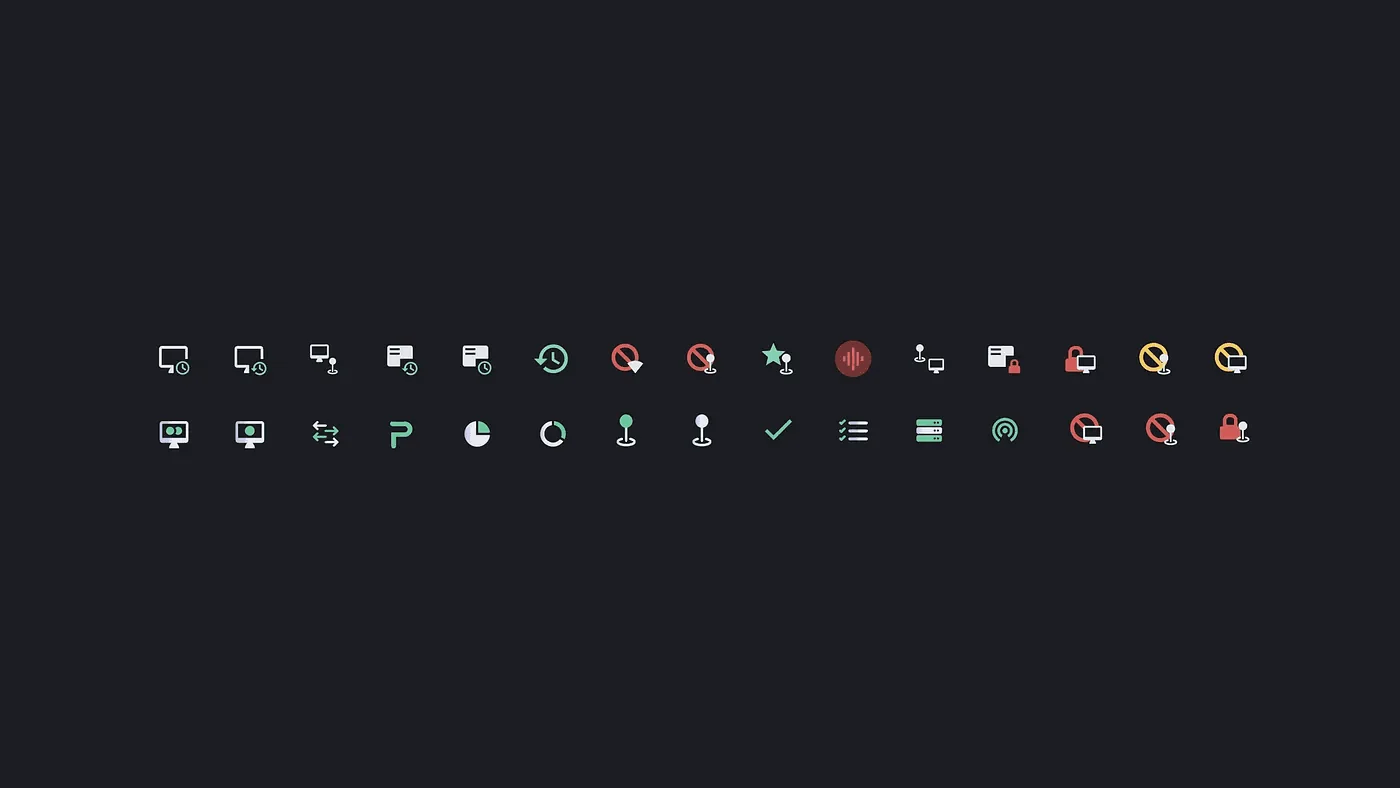
Some of the icons used in the platform.
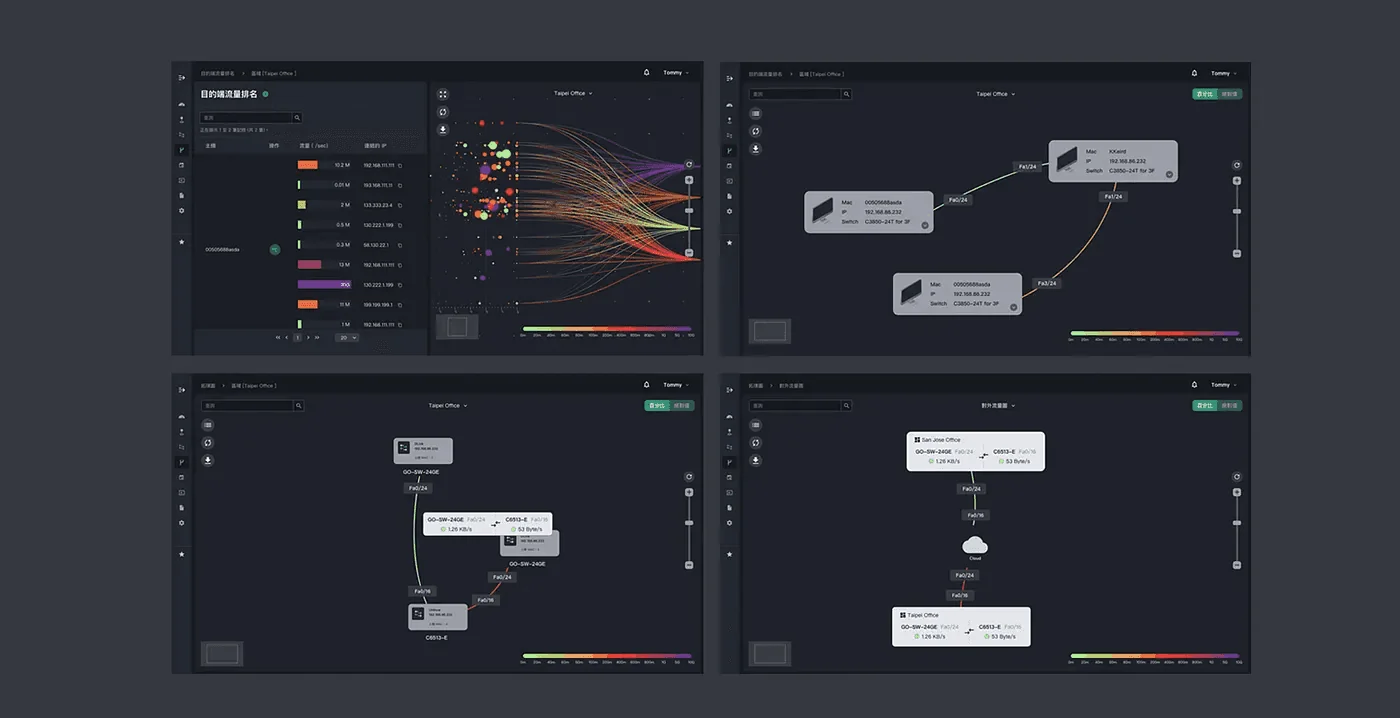
The topology view, with device links and traffic direction.
Several topology and traffic views side by side.

For a professional back office whose features keep growing, the first meeting can confirm the scope of a rework.

(Result)

Delivered in six months and shown at a security expo

At the start, the client wanted the whole project finished before a security expo. After six months it was delivered on schedule, and the platform team gained a good number of partnership opportunities at the expo.

The experience work covers paths such as live monitoring, compliance pre-checks, IP assignment and usage control.
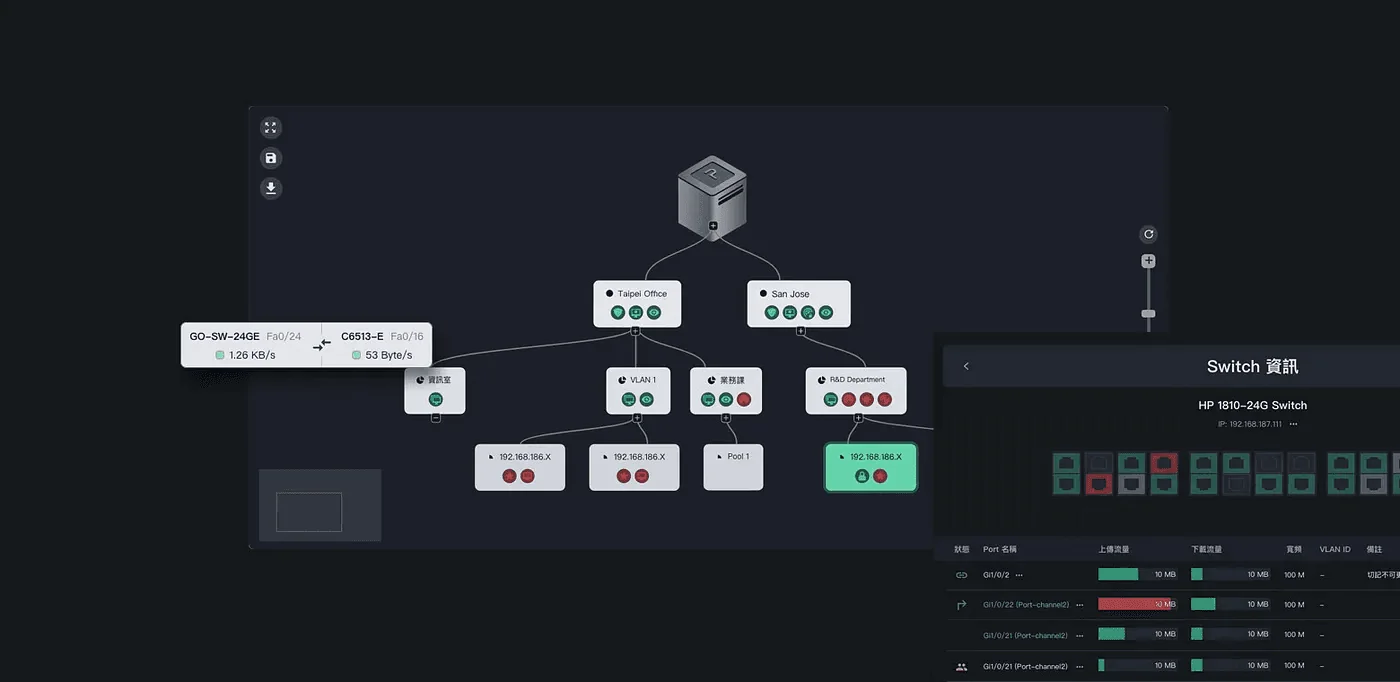
Functional objects visualized, such as probes and switches.
The report page, with traffic trends and a list.

(Field notes)

Methods and measurements, open each one

Delivery and Maintenance Evidence for Public-Sector Projects in Taiwan

When no root cause turns up, the report still states the mechanism, the sequence, and the data it could not reach Related method
When no root cause turns up, the report still states the mechanism, the sequence, and the data it could not reach
  1. Establish the mechanismWhether the kernel and existing processes are running, and which kind of system call fails
  2. Establish the sequenceThe order and time window in which components stopped
  3. Examine the most suspect component’s logsWrite down the handling for both outcomes before looking
  • The log shows an error
    Root cause can be identifiedAttach the error text and the time
  • The log stops with no error
    Record in writing: “reviewed, nothing abnormal found”As useful as finding an error
  • The data is not on the host
    List as “obtainable only from outside”Security software console, management console, virtualization platform
  • Whatever the result
    List the systemic risksIn the same report
Read the full article

The first meeting takes 15 to 30 minutes and gives a direction, a budget range and a draft timeline.

Polish+Next case: The event entrance became a Web AR experience that works on a phone

(Contact)

Start a project.

Three steps to a clear direction and budget range.

  1. 01Book the first meeting: choose a time. A full specification is not required.
  2. 02A 15 to 30 minute online consultation: direction, budget range, and draft timeline.
  3. 03After materials are reviewed, a quote and delivery specification follows in about 3 to 5 working days.
Email
hello@polish-design.com.tw
Mailing address
3F, No. 191-1, Zhifu Rd., Zhongshan Dist., Taipei 104, Taiwan

Book the first meeting

Monday to Friday, 16:00–18:0030 minutes online

Choose a time, then confirm with a Google account or an email address. A confirmed booking can be added to the calendar.

Choose a time


Or send the details first

Not ready to pick a time yet: leave the project details here and the team replies by email. A meeting can still be booked right after sending.

More details (optional): service, stage, links, source

Information is used only to evaluate this project.

ISO/IEC 27001:2022 certificate

(Certificate)

ISO/IEC 27001:2022

Certification body
ARES International Certification
Scope
The development process for interactive immersive 3D systems, and network and infrastructure operations and management.

Verify with ARES