

The overseas education fair began as an in-person event with about 60 students. After four years of collaboration with the development team, the NTU Overseas Education Fair is an online fair that more than 12,000 students sign in to. The online version draws a 3D world map in the browser with Three.js. The 289 exchange schools stand as small houses on islands across 10 regions. School quotas, introductions, and city data sit in an information window that opens on click, and points, the leaderboard, and event pages sit in pop-up windows.
The sections below cover the scene, camera, data, windows, loading, and the points data flow. For the overall approach to prize campaigns, see how prize campaign platforms are built. For the full build scope, see campaign platforms and admin.
Choosing a display format
The exchange schools are spread across every continent and number 289 in all. That much complex information is hard to show at once on an ordinary one-page site, and the layout would not stay tidy. The core message of the fair is that every student has a chance to go on exchange, so the page has to show how many choices exist as soon as a student arrives, and it also has to let interested students read the details of each school. The home page therefore uses a 3D world map for the overall picture, while school details, the registration timeline, and event information sit on a one-page site and in information windows.

Many online exhibitions in recent years have used VR. VR gives a strong sense of presence, yet it is hard to walk through a whole exhibition, users get lost easily, and the content is mostly images and video, which suit large amounts of text poorly. School information happens to be mostly text and lists.
Usability is the criterion for judging a display format. ISO 9241-11:2018 defines it as the extent to which specified users can achieve specified goals with effectiveness, efficiency, and satisfaction in a specified context of use (ISO, 2018). The standard also notes that usability describes the outcome of an interaction and does not treat it as a property of the product itself.
- Write down what the event must achieveFor example, show how many choices exist, and drive registration
- List the content people must be able to readFor example, schools, quotas, registration timeline
- Content is mostly text and lists, and needs comparing and looking up3D world map plus one-page siteThe map shows the whole picture, and the one-page site holds the details
- Content is mostly images and video, and presence matters mostVR exhibition hallStrong presence, but a full walk-through takes time and text is hard to place
How the 3D scene is built
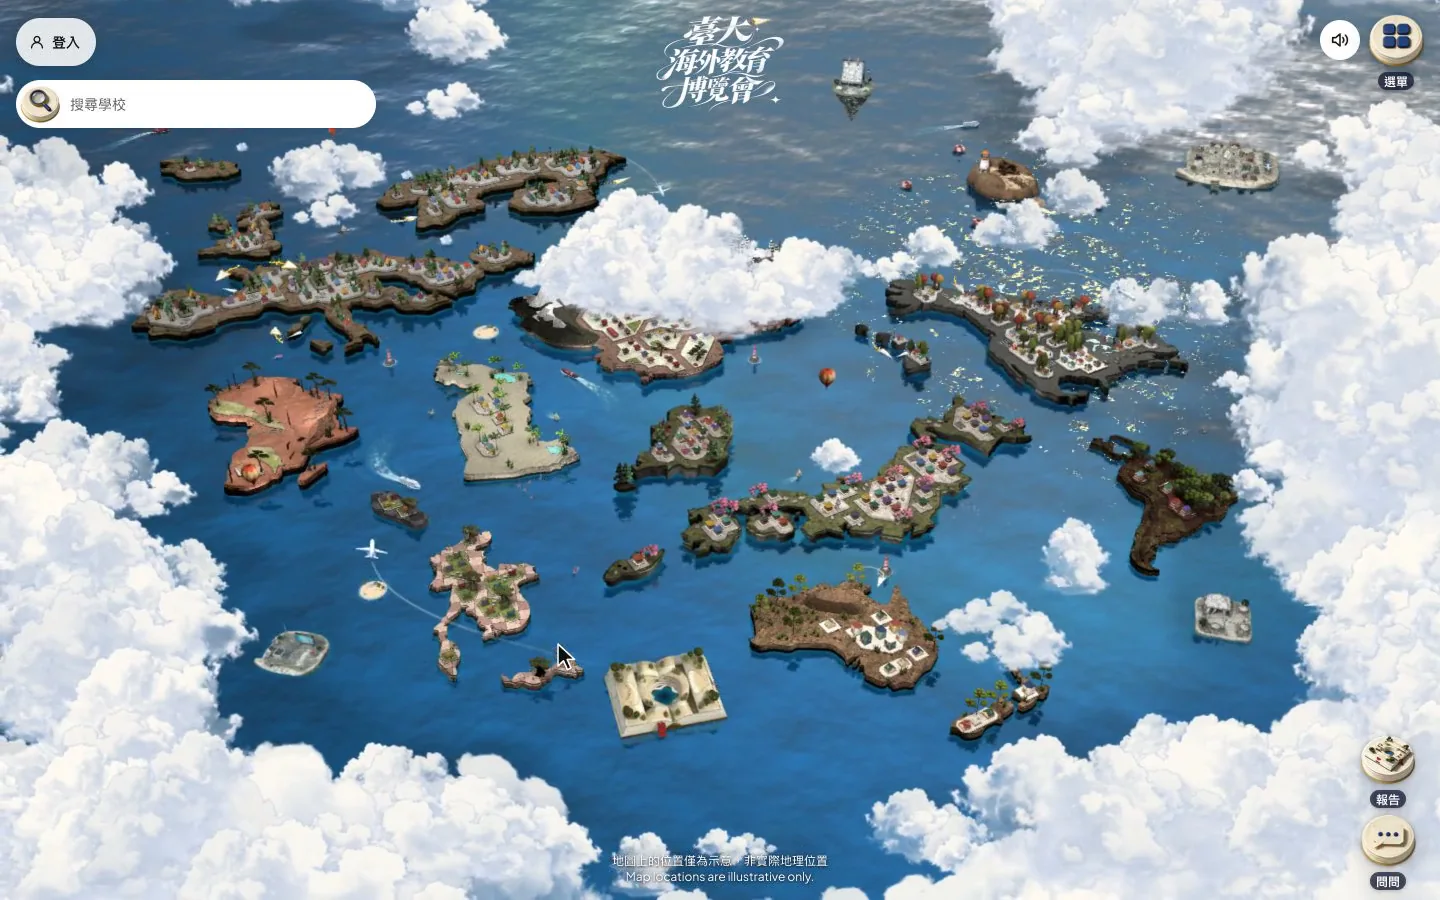
The scene is built with Three.js. The whole page has a single WebGL renderer, and the map and the cloud layer on the entry page share one scene and one camera. This kind of path, which starts with an overview and zooms in step by step, falls within the scope of 3D interactive websites. The ground of each of the 10 regions is one model, with positions recorded in a layout file, and the regions sit side by side on one sea. The ground uses textures with lighting baked in ahead of time and is drawn with an unlit material, so the scene has no lights, shadow maps, or post-processing.
Baking moves the lighting computation to production time and leaves only texture sampling at run time. MDN's WebGL guidance recommends budgeting video memory conservatively and offering different quality options (MDN Web Docs, 2026). There are 11 ground textures, each 1024 x 1024, compressed in KTX2 format and totaling about 1.5 MB. Render resolution has two tiers: up to 2x on desktop and up to 1.5x on touch devices. At 2x, multisample antialiasing is turned off, because the edges are already fine enough and the video memory is saved.
The school buildings come in 22 designs, modeled in Blender with scripts. Each design has a close-up version of about 7 to 43 KB and a distant version of about 7 to 11 KB. The position, orientation, and size of every school are recorded in one data file, and buildings of the same design are drawn together with instancing. Lighting is precomputed for four slanted orientations, and the screen interpolates between those orientations according to the actual orientation of each building.
Roofs and walls are colored from a palette for each region, and two neighboring schools must look different. For each school, the three nearest schools and every school within four building widths count as neighbors. The roof color difference and the wall color difference between two neighbors, measured as straight-line distance in CIELAB color space, must each be at least 20. Colors are assigned with a greedy graph-coloring method: the school with the fewest remaining color options is assigned first, and a hash of the school code decides which slot to start picking from, so a school gets the same colors on every load.
The sea and sky use the Water and Sky components from Three.js, with shallow water and foam lines added along the shore. Once the camera has been still for more than 1 second, the redraw rate drops, and the update rate of the sea reflection drops a further step. On the entry page, scrolling down lowers rendering to 30 fps, and drawing stops when the first screen has scrolled out of view. With an information window open and the camera still, rendering runs at about 10 fps.
Camera and gestures
Controls support mouse drag, scroll wheel, trackpad, one-finger drag, and two-finger pinch. Zoom follows an exponential curve, so every input step scales the view by the same ratio. Drag speed is multiplied by the current zoom, which lets a single drag cover enough distance when the view is far out. Camera smoothing is computed from the time elapsed per frame, so the feel is the same on devices with different frame rates.
Gesture details were tuned on real devices. A touch that starts within 20 px of the left or right edge of the screen does not drag the camera, which leaves that edge to the system back gesture. The pointer must move more than 6 px to count as a drag, so a drag that starts on a place label is not read as a click when it is released. Mouse parallax is enabled only on the desktop layout, at widths of 768 px and above.
Zoom works in stages. As the view moves in, region labels fade out before the school emblems appear. The first time a scroll wheel or a pinch passes the region-label level, there is slight damping: only four tenths of the input takes effect, and continued scrolling passes through. Double-click and the plus and minus keys move one level at a time, in this order: overview, region labels, schools, closest. Selecting a region or a school moves the camera to the target in 1 second and then zooms in over 0.4 seconds. The starting view is the farthest overview, and the point the camera looks at is limited to the outer frame of the world.
School data and search
School data comes from a read-only interface that the back end exposes publicly. After entry, the page fetches one school list for each of the 10 regions and one list of country names, and each list is fetched only once during the whole visit. The map emblems, the school list, search, and the school page all share this data. Emblem positions on the map are recorded in a coordinates file and matched to the list by school code. The school counts shown on the entry page, in the carousel, and in the user guide are also read from this list, and the counts add up to 289.
User's browser
- 3D scene and cameraDrawn with Three.js, gestures handled locally
- School searchMatches school name, short name, country, and region
- Overlays and URLsEach layer has its own URL and browser history entry
Development team's server
- School and country listsOne list for each of the 10 regions, read-only
- LeaderboardCached on the server for 60 seconds
- Event rulesOne JSON per edition, editable in the admin
Stays in the browserThe camera, gestures, and school search make no calls to the back end
Based on the actual interfaces of the fair's front end and back end.
Search matches inside the browser and makes no call to the back end. Input is split by half-width or full-width spaces and capped at 5 keywords, and every keyword must appear in at least one of the school name, school code, short name, English name, country, or region name. Region chips filter the list, and once a school is selected the camera flies to it.
On a phone the search bar is fixed at the bottom of the screen and opens a bottom drawer that lists the schools. The tutorial appears as a bottom panel, and the menu unfolds from the top right. The information window also holds a school quiz, which helps students learn more about each school.
Entry page, windows, and URLs
The entry page holds the full event information, and pressing start sends the camera through the clouds into the map. The page is ordered from top to bottom by importance:
- The map entrance, at the very top.
- The core message: every student has a chance to go on exchange.
- The registration timeline, placed right after the core message to raise the registration conversion rate.
- The points game, last.
The top of the layout does carry weight. In an eye-tracking study of ordinary web pages by Nielsen Norman Group, with 120 participants, about 57% of viewing time fell on the first screen and about 74% on the first two screens (Fessenden, 2018). The pages studied were news, e-commerce, and blogs, and none was an exhibition site, so the study is used here only as a hint about layout order: put the content that matters most at the top.
The information window, programs, events, announcements, and the points page are all overlays on top of the map, and each layer has its own URL. Opening a layer adds one entry to the browser history, so the back gesture on a phone, or the back button, closes the topmost layer first and the site stays open. The address bar shows the path of the top layer, for example /map/region-code, /school/school-code, or /live/program-code. When one of these URLs is opened directly, the page loads the world first and then the camera flies to the matching region or school. URL parameters from the earlier version still work and are converted to the same kind of path after entry.
Based on the actual screens of the fair.
Loading order
Each of the 10 regions has two ground models, a distant version and a close-up version. The distant versions total about 2.8 MB and the close-up versions about 17.7 MB. Normally only the distant versions are loaded, and the close-up version replaces one when the camera moves into that region, with at most 2 regions kept at the same time. The models for the partner island, the events island, and the programs and live island are each under 1 MB. The three are downloaded only once the start button on the entry page can be pressed, and then fade in over 0.9 seconds.
The cloud texture is 4096 x 2048 on desktop and scaled down to 2048 x 1024 on phones. How the download and memory budgets are set is covered in Web 3D performance engineering. The same layered loading applied to a showroom for a property development is in how 3D property showroom websites are built.
Points and leaderboard data flow
After login, students can earn points through daily login, browsing fair content, watching live events, and filling in surveys, and the points feed a leaderboard. Each point source has its own switch. The counts, times, and prizes are recorded in one rules JSON for each edition, stored in the database and editable from the admin, so no numbers are hard-coded. The default rule values, the field whitelist check, and the public version of the rules are all handled by the same module.
The leaderboard ranks by total accumulated points and counts student accounts only. When scores tie, the student who reached that total first ranks higher, so no ranks are tied and settlement needs no drawing of lots. The public leaderboard response contains only rank, nickname, and score. Each student decides whether to show a nickname, and those who do not are displayed as "Classmate". The server caches each leaderboard for 60 seconds, while a student's own rank and total come back with the profile data after login, so no separate query is needed.
An invitation program lets signed-in students bring the next group of students to the fair, and rewards grow with the number of successful invitations. Points break one visit into small actions that can repeat, and the empirical evidence on this kind of design comes with conditions. Hamari et al. reviewed 24 peer-reviewed empirical papers and concluded that gamification has positive effects, but that the effects depend heavily on the context and the users (Hamari et al., 2014). For a national campaign with a longer schedule, see on-site verification and scoring in a national campaign.
Results
Over four years of collaboration, the fair changed from an in-person event with about 60 students into an online fair with more than 12,000 students signed in. The remaining figures are below.
| Item | Figure | Condition |
|---|---|---|
| Student count | From about 60 to more than 12,000 | An in-person event became an online fair, and online counts students who signed in |
| Sign-ins | Within the first 7 days of the fair, 2,000 students signed in with a student email address | One edition |
| Site visits | In 10 days, passed the 100,000 visits recorded in the whole previous year | Same edition; views of live programs also broke the all-time record |
| Consecutive return | More than 20% of signed-in students browsed the site for more than 7 days in a row | Share of signed-in students |
| Session length | Up to 3 hours, and more than 10% of students stayed over 2 hours in a single session | A single visit |
Cases where this approach does not fit
- Events with only a dozen or so exhibitors and a small amount of information. A one-page site with a filter shows everything at once, and the effort of building a 3D map would not pay back.
- Events whose content is mostly images and video and whose point is presence, such as a venue tour. VR or a scene-based presentation suits this kind of content better.
- Single-day or single-session briefings, and events that do not need to keep sign-in data. Points and invitations make sense only when people return over several days.
What to prepare before starting
- What participants must complete at the event, such as registering, signing in, watching a livestream, or filling in a survey, and the order of those steps
- The list of exhibitors or schools, and the data items to show for each entry
- The event dates, and the arrangement of livestreams and programs
- Sign-in eligibility, for example whether it is limited to student email addresses
- Prizes and budget
Once these are ready, describe the event size and schedule to discuss moving an exhibition online.