(Case study) Higher education・Polish 3D / Polish AI / Polish+
From an in-person event of about 60 students to an online expo with more than 12,000 student logins
Four years of collaboration, from 2022 to 2026. The overseas education expo moved from an in-person event of about 60 participating students to an online expo with more than 12,000 student logins. Information on 289 exchange schools is extensive and complex, so the site presents it on a 3D world map and carries the details in a one-page site.
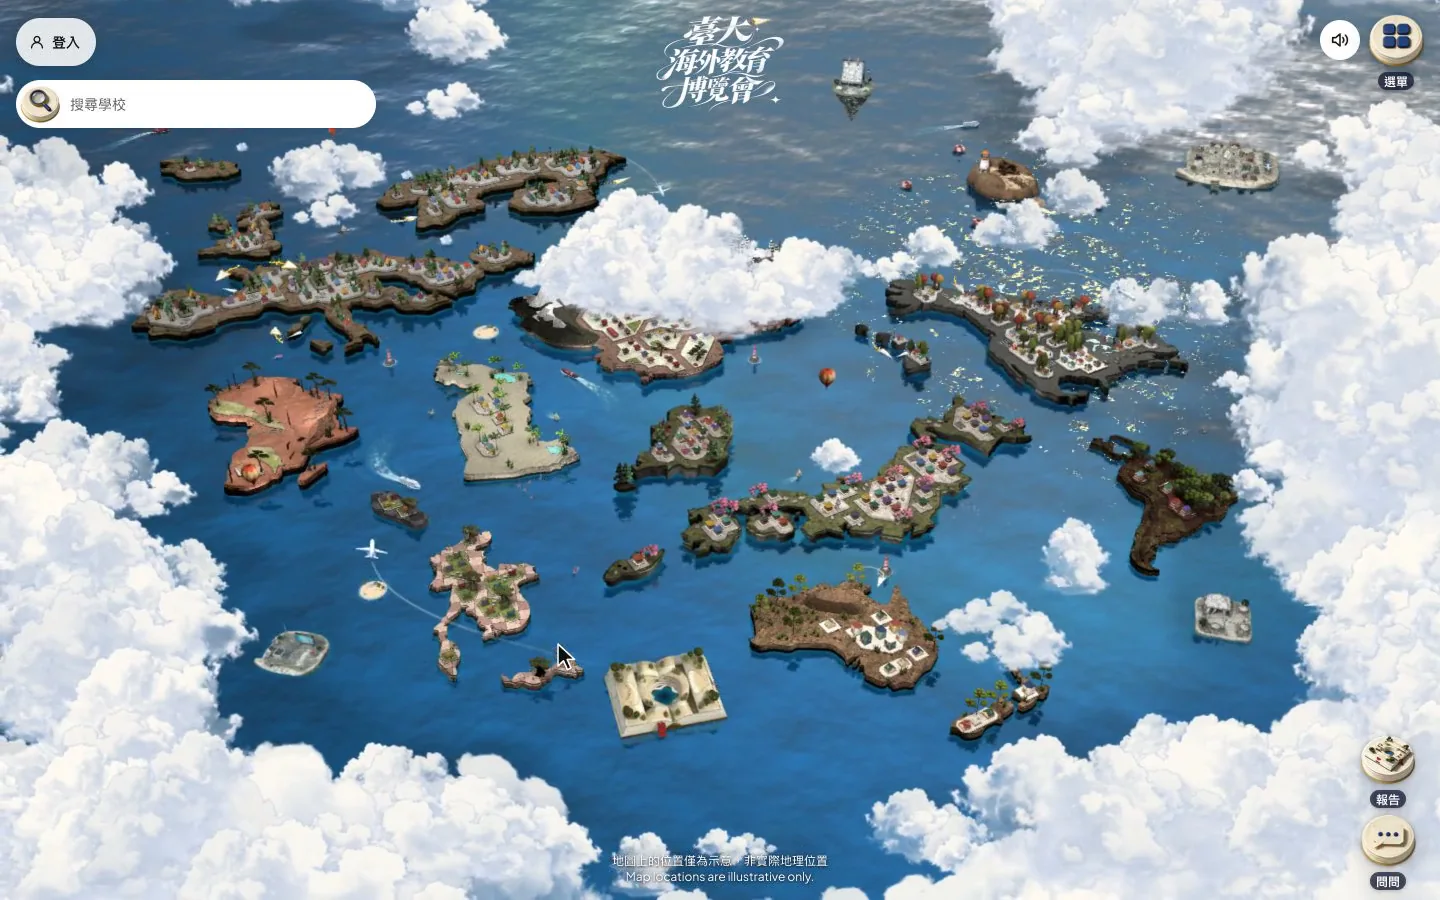
On entry the camera flies through the clouds into a 3D world map. Guide cards explain how to move around and find a school, and selecting a region flies onto its island with every school crest in view.
~60 → 12,000+students, from an in-person event to online logins
4years together
289partner schools
Industry
Higher education
Service
Polish 3D, Polish AI, Polish+
Scale
289 exchange schools
(AI assistant)
Ask about selection, compare schools, get a report from AI
Students enter a question and choose schools and topics. The AI assistant turns the designated data into a school comparison report, with a source for every line.
The question flow, phone screen recording. The screen content is sample data.
(AI assistant)
Answers use only the designated data, and every line cites a source
Opening the report shows the question, a summary, a section for each topic, a side-by-side set of figures for each school, next steps and the sources. Every statement carries a source number, and all sources are listed at the end. The screen content is sample data.After choosing a stage and a topic, questions are asked in a chat. Each answer carries source numbers, tapping one shows the official text, and the next question can follow right away. The screen content is sample data.
The assistant answers only from designated data, personal data is masked before sending, and every citation is checked by code
Student's phone
Enter a question
Choose schools and topics
Question and topicsComparison report
Development team's service
MaskingStudent IDs, emails and phone numbers are masked before sending
Designated dataNo content from the web
Line-by-line checkCitations that do not match are removed
QuotaWeekly quota and daily cap are adjustable
Designated dataDraft
Model provider
Language model
Never sent outStudent IDs, emails and phone numbers.
Scope: the question and report flow of the on-site AI assistant.
Related method
How citations are kept honest: any point that fails verification is dropped from the answer.
Validation follows the model’s answer: failing points are dropped, and dropping every point returns “no answer yet”
Retrieve and compare to the thresholdThe model is involved only once the confidence threshold, which takes in score and coverage, is passed
Model answers from the sourcesEach point carries a source number
Validator checks rule by ruleNumbers must appear in the source or the question; the model may not add words of judgment
Retrieval fails the threshold
Reply “no organized answer yet”List the three closest questions, log one miss, hand off to a person
Validation passes in full
Answer with sourcesEvery point traces back to a source
Some points fail validation
Retry once, drop the points that still failIf all are dropped, no forced answer; if both attempts fail, return an error and do not count the attempt
Extensive information, and no easy way to show how many choices exist
The 289 exchange schools are spread across every continent, and the information is extensive and complex. An ordinary one-page site struggles to show that many schools at once, and the page rarely looks tidy.
The expo aims to convey the information simply and clearly and to draw students to apply for exchange. The core message challenges an assumption in one line: everyone has a chance to go on exchange.
A side list shows every participating school and filters by region. Choosing one sends the camera to that school and opens its details.On a phone, the search bar at the bottom opens the school list. After filtering by region and picking a school, the camera flies there and an information sheet rises.
(Approach)
A 3D world map shows every school, and a one-page site carries the details
Many online exhibitions now use VR, which suits a sense of space. Finishing a full VR exhibition takes many steps, though, visitors get lost easily, and the content is mostly images and video, which suits large amounts of text poorly.
The home page is therefore a 3D world map that shows how many schools there are at a glance. Complex information goes into a one-page site that is easier to read. A map also invites students to explore independently and makes the visit feel more like walking an expo floor.
On the front end, Three.js renders the 3D models in the browser, and parameters such as swipe speed, map size, boundaries and damping were tuned by hand so that controls behave as expected on every device. To protect performance, the scene uses no real-time lighting. Lighting is baked into textures, shadows under the map tiles are image files kept as small as possible, and the look carries a slight pixel-art feel.
Desktop
The whole world first, then step by step into each continent
The home page opens with clouds and paper planes. Pressing Start exploring flies the camera into the 3D world map, and a six-step tutorial covers the world map, finding schools, application requirements, senior students’ experiences, the AI assistant and favorites. After that, the scroll wheel zooms and dragging pans, flying from the full view into each continent, where schools stand as small houses on the map tiles. The menu gathers programs and live streams, events, announcements, the calendar, the school catalog and partner institutions.
The 3D world map, with schools on each continent shown as islands.
Phone
Just as complete on a phone, with the tutorial in a bottom panel
On a phone the map uses one-finger dragging and two-finger zoom, the tutorial appears in a bottom panel, school search stays fixed at the bottom of the screen, and the menu opens from the top right.
The phone version flies into the same 3D world map. One finger drags, two fingers zoom, and region names appear as the view comes closer.
Related method
The loading order a map site follows on a slow phone connection.
Only essential resources load before the page is interactive; whatever cannot be seen is added afterward
Before interactive
Main scene and key partsThe reveal condition waits only for these
Island shellsPositions come from constants; a placeholder holds the place until the model arrives
Images on the first screenLayout reserves space by width and height
Deferred models and imagesPlaceholder shells and reserved sizes
After interactive
Models of three islandsAbout 2.5 MB in all, swapped in and faded in on arrival
Images seen only laterNo URL is given before interactive
Pages that need no 3DThe countdown page loads no 3D JavaScript
Never block the first interactionWhatever cannot be seen is deferred and added one piece at a time once the user can act
An event-map website, adjustments measured on an emulated phone with slow 4G
The world map is the star, and an entry page carries the full event information before visitors reach it, giving the step into the map a sense of ceremony. The order puts the map on top, then the core message, then the application schedule to raise conversion, and the points game last.
The shows and live island, the event island and the calendar island each act as an entry point, opening program replays, event sign-up and the overall schedule.On a phone, the menu leads to shows and live, events and the calendar, each opening as a full-page list that scrolls vertically.
School information
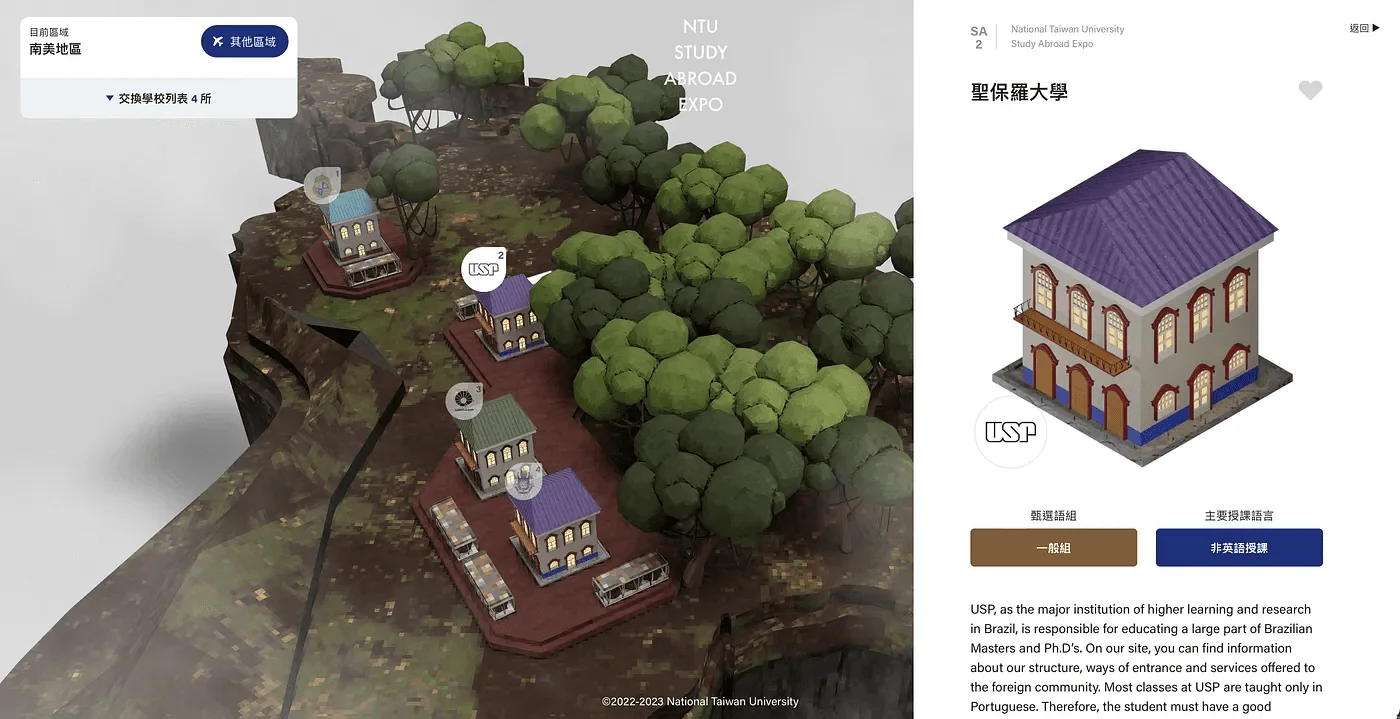
Points and raffle pages are tucked into a modal instead of sitting on the map page. This separates the student-only activity from the rest of the content, and visitors who are not students feel little gap. School information can be explored on the map or browsed as a list with filters, and school quizzes in the modal help students learn about each school.
After a school is selected, the modal shows information on that school.
Selecting a region flies the camera onto its island, where school crests appear on the buildings. Hovering shows the school name, and one click opens places, introduction and city.On a phone, tapping a region flies onto its island, and tapping a crest raises an information sheet from the bottom. Swiping up reads places, introduction and a city map.
Points and invitations
Prizes draw students to log in and play the points game. Daily logins, exploring expo content, watching the live broadcast and completing a survey all earn points, and a leaderboard adds competition. The top scorers win prizes such as an iPad or an Apple Watch. An invitation system rewards each successful referral, so more invitations mean more rewards.
(Back office)
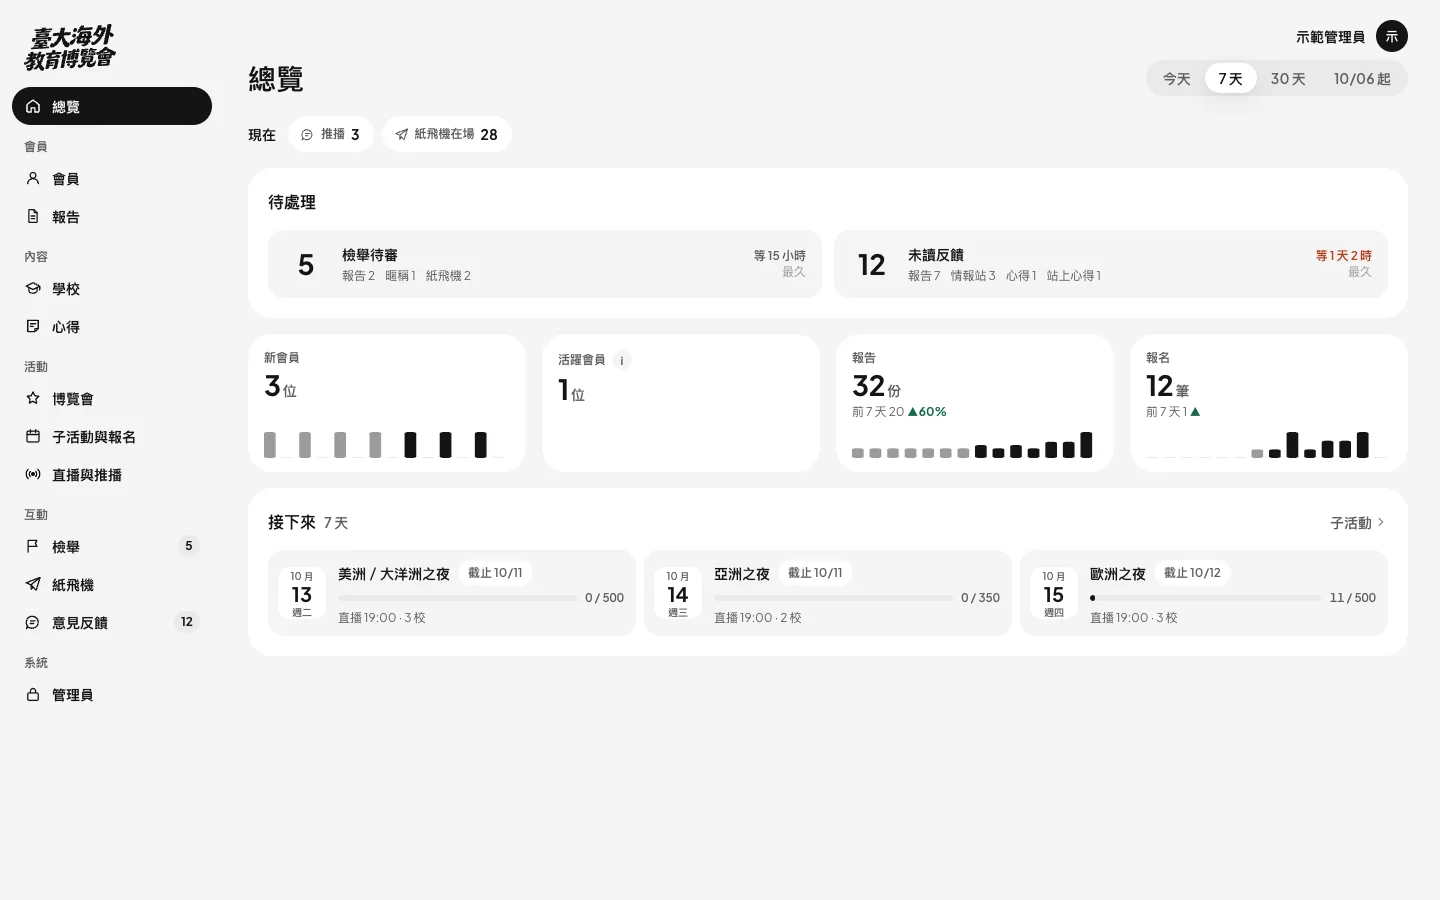
During the event, the back office starts with what needs handling
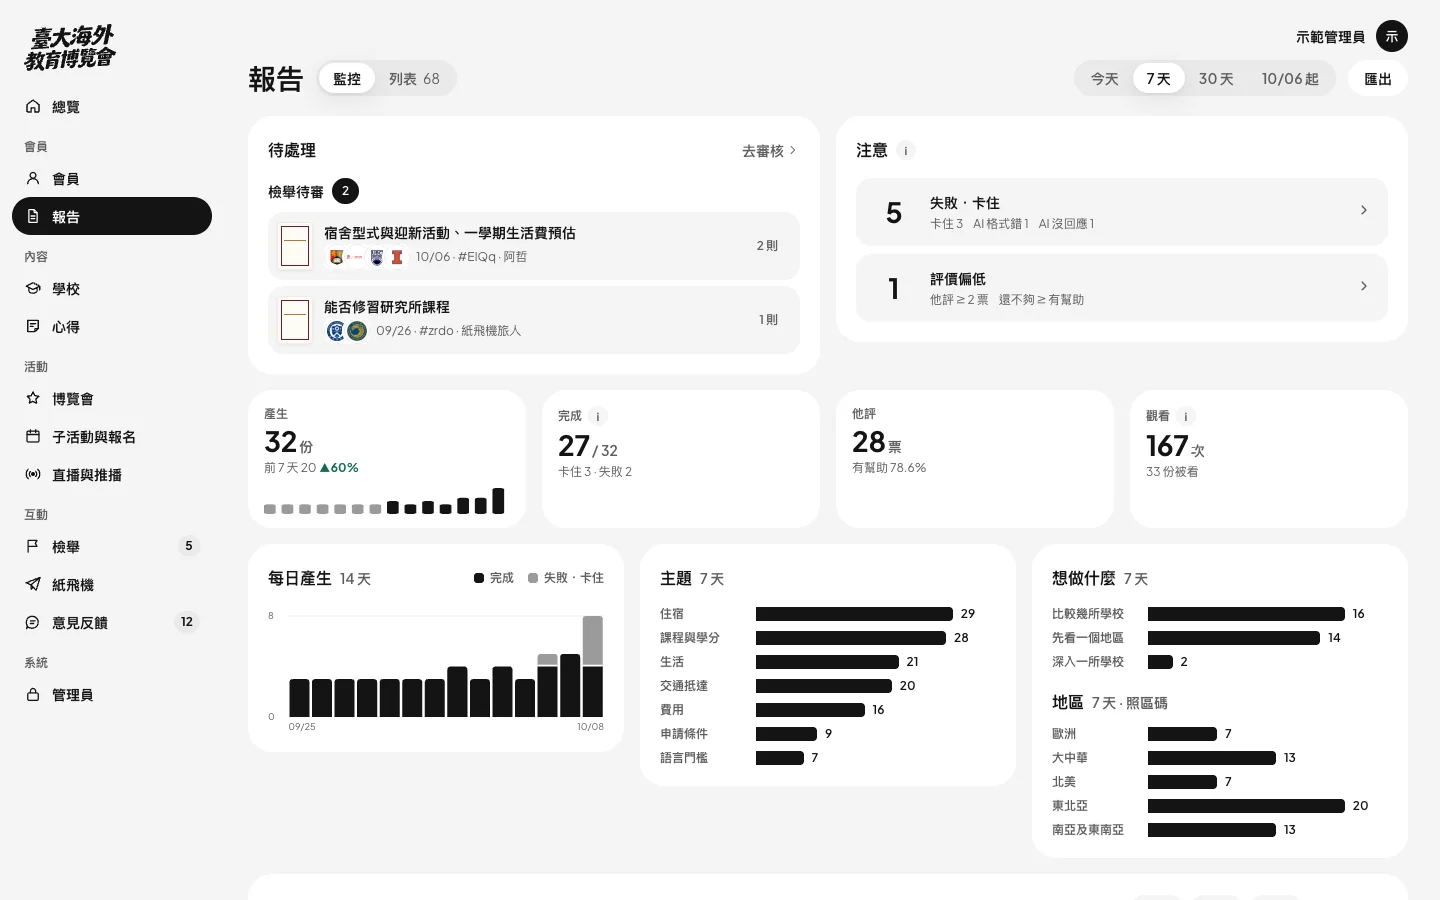
After login, the first thing shown is what needs handling, followed by trends and upcoming sessions. Each metric opens to its full calculation, using the same definition as the data queries.
Desktop recording: overview, traffic and reports, then a metric opened to show its calculation. The screen content is sample data.
Back-office overview: items to handle, trends and sessions.The reports view in the back office.
Over four years, participating students grew from about 60 to more than 12,000
From 2022 to 2026, the expo moved from an in-person event of about 60 participating students to an online expo with more than 12,000 student logins. In one edition, 2,000 students logged in with student email accounts within 7 days of opening. Site views for all of the previous year totaled 100,000, and that edition passed the figure in just 10 days. Live broadcast views also set a new record.
More than 20% of logged-in students browsed the site for over 7 consecutive days, the longest single visit lasted 3 hours, and more than 10% of students stayed over 2 hours in a single visit.
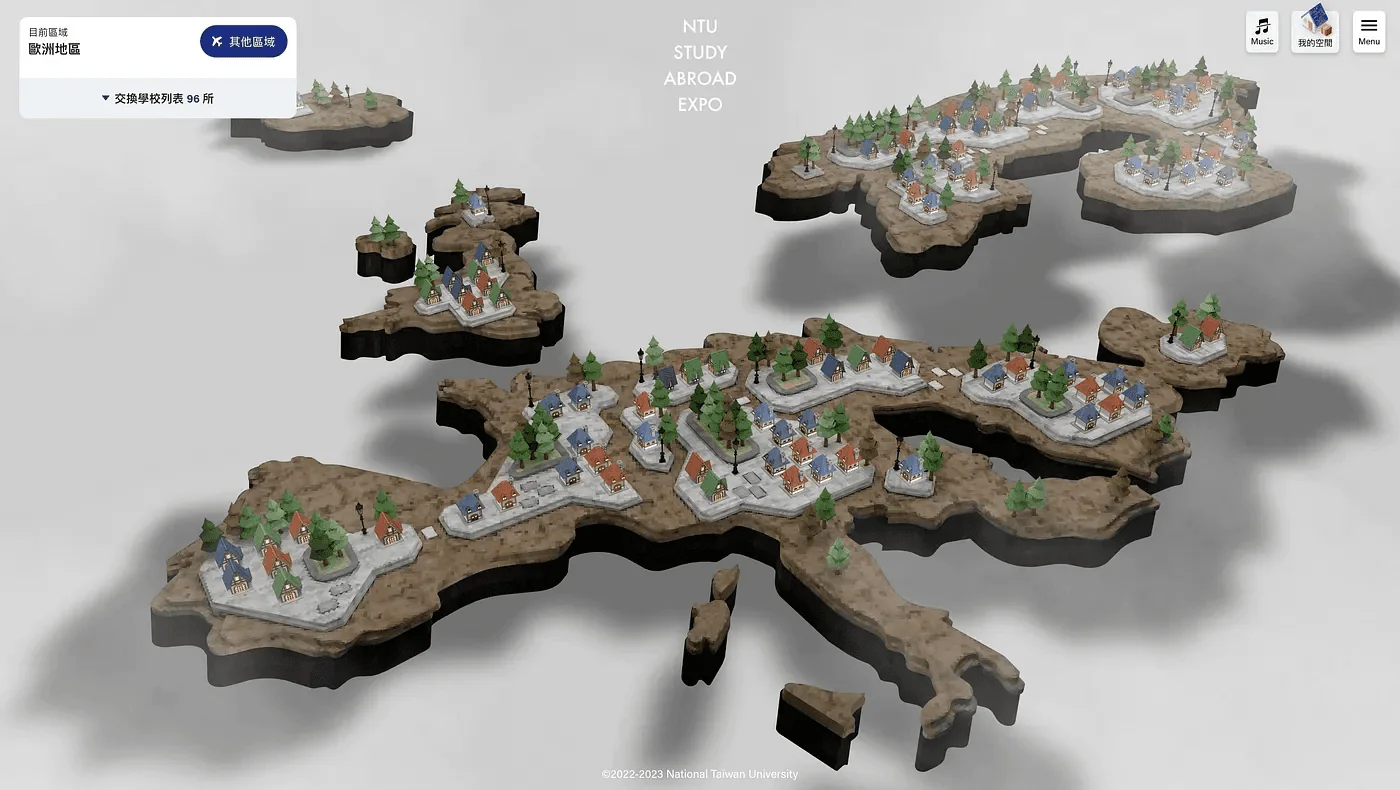
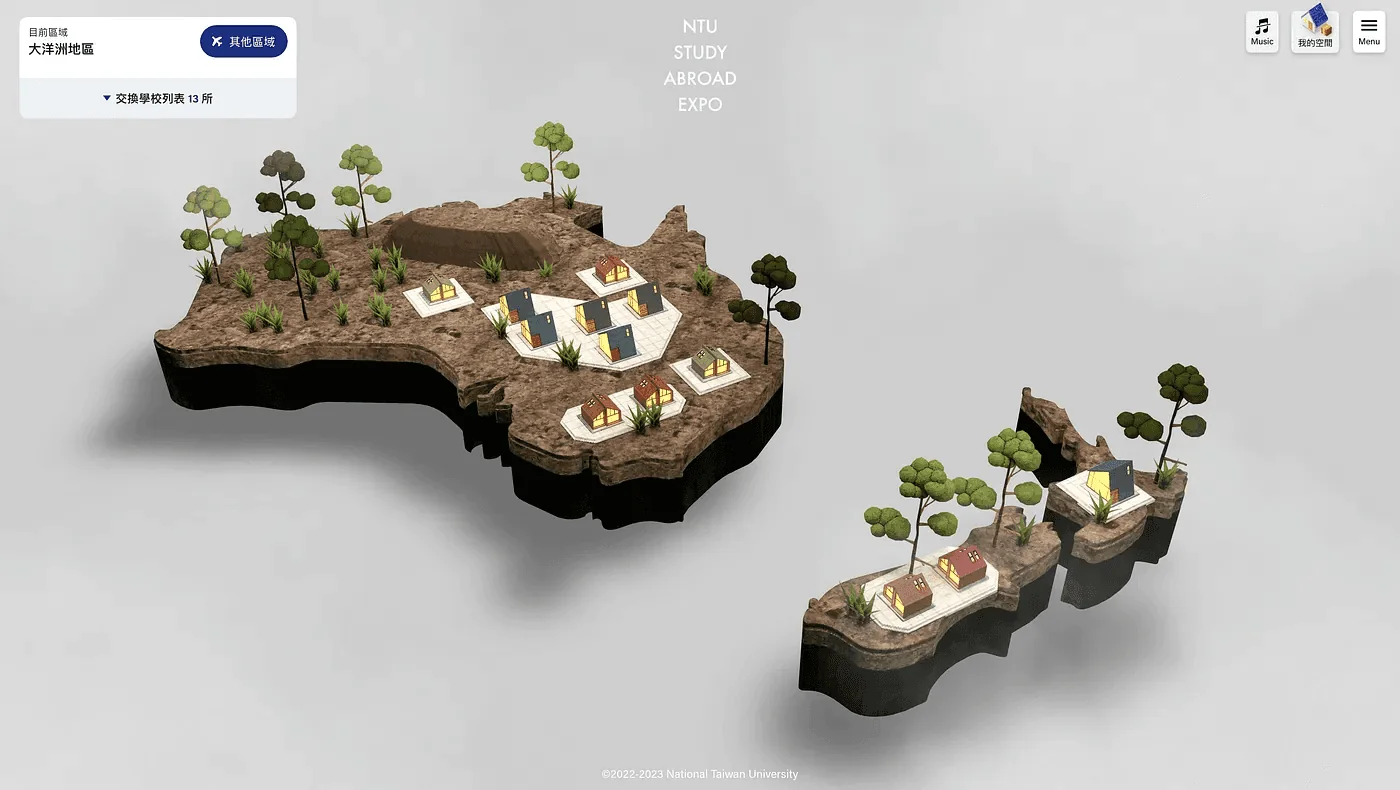
School roofs and bodies are designed to suit the tone of each continent, and varied combinations keep the scenery from feeling repetitive. The opening pairs a soaring flyover sound with an original score, carrying visitors from the whole world to each region.
Europe: schools arranged on the map tiles in a style suited to the region.Oceania: each continent carries its own tone.
Every path that calls the model passes through the same guard and allowance first Related methodEvery path that calls the model passes through the same guard and allowance first
User’s browser
QuestionThe user types a question
Question textAnswer with sources
Development team’s service
Entry guardProgrammatic matching for injection, abuse, and gibberish, plus allowance and rate limits
Retrieval and thresholdNo model call if the threshold is not met
ValidatorChecks the model’s draft rule by rule
A question that passed the guard, plus retrieved sourcesDraft with source numbers
Model provider
Language modelDrafts an answer from the sources
Not sent outA question that hits a guard never reaches the model; the log keeps only the category, not the original text
Scope: the user-request path of the answering service; batch work uses a separate key
In evaluation, model calls become files, and the same request always gets the same answer Related methodIn evaluation, model calls become files, and the same request always gets the same answer
Q&A system
Break down the questionEach call gets a fixed file name derived from its request
Write the answer and verifyAnswers that fail verification are moved to a separate folder with a failing exit code, and reappear in the next round
Request contentsAnswer
File directory
Request fileOne per call that has no answer
Answer fileAn existing answer is reused, never re-answered
Request file contentsAnswer file contents
Stand-in answerer
Small modelOne request per run, answered question by question
Stays inside the boundaryThe database is read-only; API-key environment variables are cleared in evaluation mode; network requests to the model provider are blocked.
Scope: offline evaluation mode, with no real model and no external services.
Read the full articleOnce a question arrives, retrieval score and verification results route it to an answer, an abstention, or a person Related methodOnce a question arrives, retrieval score and verification results route it to an answer, an abstention, or a person
Retrieve and scoreRetrieval score and fit value computed from user phrasing, keywords, and answers
Compare to thresholdsBoth values must clear the thresholds
Verify each claim's sourceSource number, numbers, and tone must all pass
Score clears the threshold and every claim passes verification
Answer with sourcesEach claim carries a source number
Score is below the threshold
Decline and hand off to a personState that no prepared official answer exists yet, list the three closest questions, and log a miss
Some claims fail verification
Retry once, then drop claims that still failKeep only the claims that pass
Every claim has been dropped
Do not force an answer; hand off to a personNo answer is produced
Read the full articleThe client writes questions and labels answers, the development team scores and tunes thresholds, and both review before launch Related methodThe client writes questions and labels answers, the development team scores and tunes thresholds, and both review before launch
Questions and labels
Scoring and thresholds
Joint review
Client
Development team
1
ClientProvide real questions and correct answersEach question pairs with the source passage judged correct, plus questions that should not be answered
2
Development teamAssemble the fixed test setEvery later change is compared against the same questions
3
ClientResolve doubts about correct answersThe client decides when sources contradict each other or a question is unclear
4
Development teamScore and measure the thresholdBetween the lowest score of answerable questions and the highest of unanswerable ones
5
ClientReview refused and failed questionsDecide whether each is a knowledge gap or a system problem
6
Development teamAdjust retrieval and rulesRe-measure the threshold and re-run the test set after each change
The client establishes the test set; the development team measures thresholds against it.
About a tenth of the excerpts the model picks fail the verbatim check Related methodAbout a tenth of the excerpts the model picks fail the verbatim check
Long PDF documentsabout 1,600
Model picks excerptsabout 15,000
Code compares to the sourceNormalize, then locate by string search
Dropped on mismatchabout a tenthIncludes those under 10 characters
Passedabout 13,000
Rounded figures from one full run.
Read the full articleA low score or a fully stripped answer goes to a person instead of a forced reply Related methodA low score or a fully stripped answer goes to a person instead of a forced reply
Keyword scoringBM25 plus synonym expansion
Compare to thresholdMeasured from test questions
Check each pointNumbers must be in source or question
Score falls short
List closest questionsHand off to a person
Check fails
Retry once with the reasonDrop failing points if it still fails
On the same scene, a single render looks several times more expensive with vertical sync off than with it on Related methodOn the same scene, a single render looks several times more expensive with vertical sync off than with it on
Vertical sync offVertical sync on
about 20 ms
Time per render after entryUse the sync-on figure
about 1 to 6 ms
First 40 renders after entry in a 3D map, approximate values; vertical sync on means a true 60 Hz
In this collaboration, POLISH showed exceptional design capability and mature professional judgment. The website's overall structure is clean and sharp, with well-judged white space, clear and orderly information, and smooth operation that gives users a fluid, comfortable browsing experience. The visual style is calm and minimal yet rich in texture, striking a fine balance between function and aesthetics. The design goes beyond surface appearance, with care visible in the details and a strong focus on user experience. Overall, it never strains to impress, yet attention to detail shows everywhere. It is a mature work in which technical expertise and aesthetics coexist.
DavidPM・NTUOIA
The first meeting takes 15 to 30 minutes and gives a direction, a budget range and a draft timeline.





 DavidPM・NTUOIA